RESOURCES (Omics and Survival Data)
We have curated an extensive collection of omics-based datasets developed through our research collaboration. This collection encompasses transcriptomic (RNA-Seq), proteomic (LC-MS/MS), and secretomic profiles of tumor and tumor-associated host cells. Additionally, it features analyses linking gene expression to overall and relapse-free survival based on published data sets. To navigate the data click on the image below.
Explanations and references
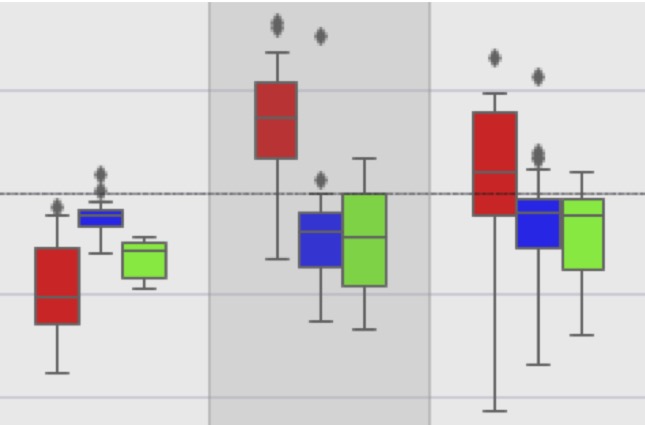
Please quote the following references if you use this data in your publications. RNA-Seq data for ascites cells: TPM for tumor cells (TU), macrophages (TAM) and T cells (TAT) (Reinartz et al., 2016; Worzfeld et al., 2018). RNA-Seq data for omental metastases: TPM for tumor cells (TU), macrophages (TAM), mesothelial cells (MESO), adipocytes (ADI) and fibroblasts (CAF) (Sommerfeld et al., 2021). Proteomic data: LC/MS-MS analysis (median LFQ) of TU, TAM and TAT from ascites (Worzfeld et al., 2018). Secretome data: LC/MS-MS analysis (median LFQ) of conditioned medium from ascites-derived TU, TAM and TAT (5-hr culture in protein-free medium) (Worzfeld et al., 2018). SOMAscan affinity proteomics data: SOMAscan signals reflecting relative levels of protein mediators in ascites, plasma from ovarian cancer patients (OC-plasma) and patients with non-malignant gynecologic diseases (N-plasma) (Finkernagel et al., 2019). Box pots show medians (horizontal line), upper and lower quartiles (box), range (whiskers) and outliers/fliers (diamonds). Association of transcriptome and survival data: 1. RFS associated with TCGA microarray data. 2. KM-Plotter RNA microarray / relapse-free survival data for HGSC (Gyorffy et al., 2012). 3. PRECOG RNA-Seq / overall survival data for ovarian cancer (Gentles et al., 2015). 4. SOMAscan ascites protein levels / RFS data for HGSC (Finkernagel et al., 2019). TCGA, KMP: data split at best fitting quantile; PRECOG: data split at median. A z-zcore of >1.96 or <-1.96 corresponds to a logrank p-value of <0.05. Positive z-scores indicate a hazard ratio >1 (shorter survival); negative z-scores indicate a hazard ratio <1 (longer survival).